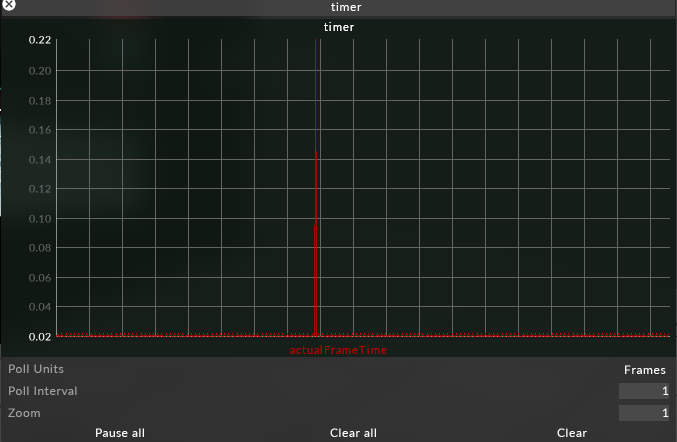
To open the Monitoring Manager, left click on the FPS in the lower right corner of the track.
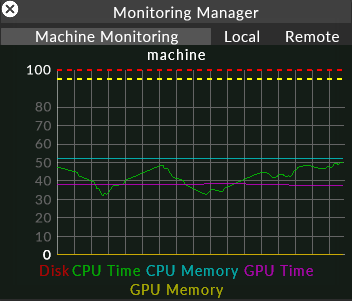
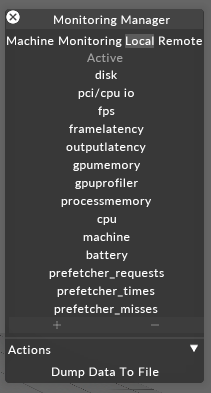
Once the Monitoring Manager window is open, left click on Local to see the list of monitoring graphs:
What is it?
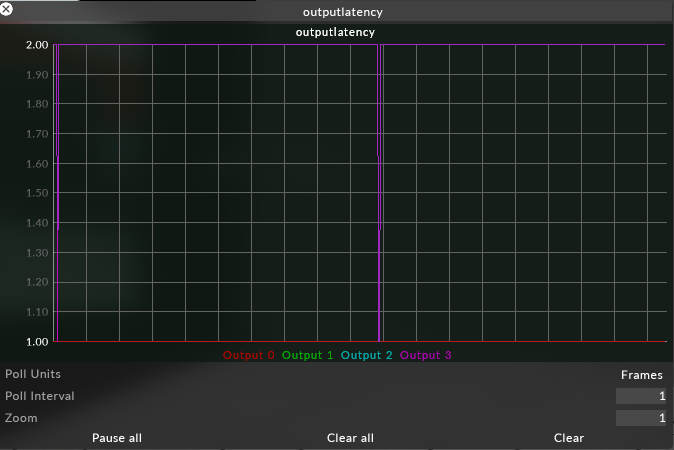
This graph shows the queue length for each output. The queue length is dictated by whether the project is running at normal latency, low latency or ultra low latency.
This graph can be used to see dropped frames. If the queue length drops down by one, then a frame has been shipped before the next frame has joined the queue. Because frames are queued, this will not be seen on the output as a dropped frame. Running in ultra low latency where frames are shipped as soon as they have rendered, means that if the next frame is ready when a frame ships, you will see a frame drop.
If running at normal latency, but the graph line drops to zero, then frames are not ready fast enough which could manifest as framedrop.
What is it?
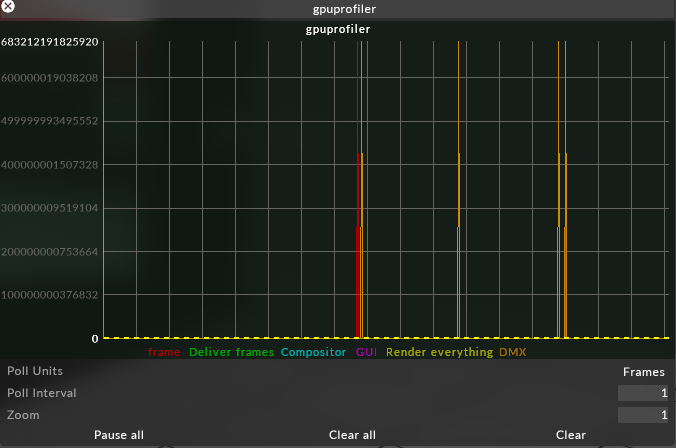
This is a cumulative graph that shows the amount of time spent in different tasks, e.g how much time spent in the GUI, how much time downloading DMX.
The sequence of events when playing back a video is:
Frames are loaded from video files -> decoded into RAM -> uploaded to the GPU -> rendered on the GPU.
Frame
The amount of time taken to render the frame on the GPU. This includes other rendering work, not just that related to video playback. When Frame finishes, the frame is ready to be presented.
Deliver Frames
The amount of time a frame takes to upload to the GPU in the sequence of events described above.
Compositor
The composite time spent on all the track elements together.
GUI
The amount of time spent rendering the GUI.
Render Everything
The cumulation of all the components that make up Compositor and GUI time.
DMX
The time spent downloading DMX
How do I use it?
When looking at the graph you can see how much time is spent in each part of the process. If any lines are going above the dotted lines then the server is dropping frames. The dotted lines indicate the maximum amount of time that can be spent at either 50fps or 60fps.
What is it?
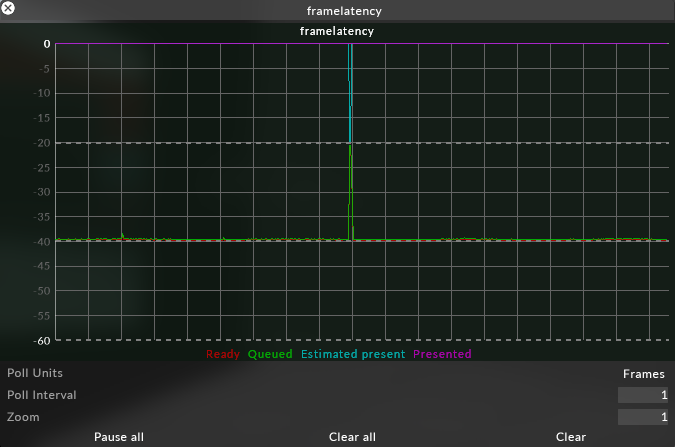
Graphs in milliseconds (ms) the journey of a frame from the time it is rendered through to being presented for output, relative to the present time which is 0.
Ready
The time that the frame was ready (rendered) at. Whenever a frame is rendered, it is ‘ready’. ‘Ready’ shows how many milliseconds in advance the frame was ready before it was actually presented. This value will vary based on the load on disguise.
Queued
Time the frame was added to the present queue. The present queue is disguise notifying windows that this is an upcoming frame. This will most likely be identical to ‘ready’ as the frame is added to the queue as soon as it is rendered. The time may be higher if the queue is full, so the frame can’t be immediately added to the queue.
Estimated Present
From when it was added to the queue, the time at which it is estimated that the frame will be presented given the length of the queue.
Present
The time at which the frame was actually presented, which is always 0. All other graphed values are relative to this.
How do I use it?
If disguise is running slow, frames will not be ready in time and will be too close to 0, or after 0. This means it is dropping frames. You will also see that if running in low or ultra low latency mode, there is less time from ‘ready’ to ‘present’, and in half speed mode the frame is ready twice as early as in full speed mode.
What is it?
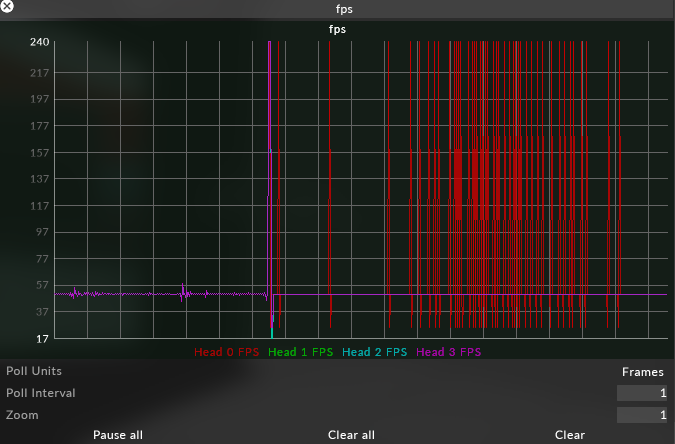
Graphs the frames per second (FPS) per head
How do I use it?
Use this graph to see if you are dropping frames on any output head
What is it?
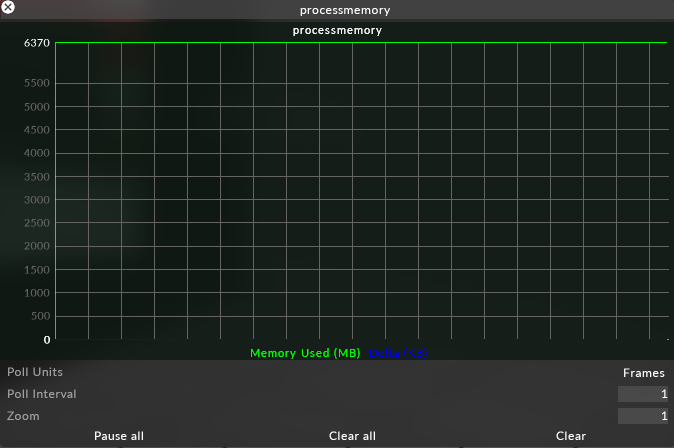
Memory Used (MB)
How much memory disguise is using.
Delta (KB)
The difference between how much memory in use from one frame to the next.
How do I use it?
You can see values changing as you add and remove resources, e.g. many of the normal actions of setting up and programming a showfile.
This graph usually should not have to be used, but it can be used if experiencing crashes to make sure they are not memory related. If there is a memory leak, the delta will continuously spike in an upwards trend.
What is it?
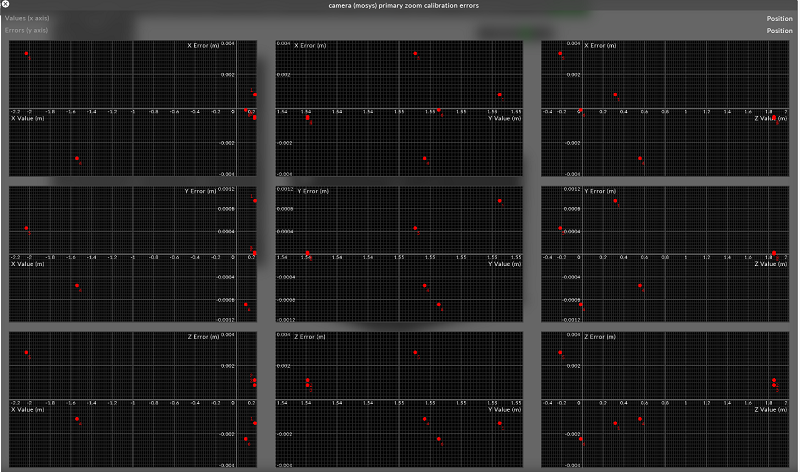
The plot calibration error graph allows you to look for correlations between camera positions and calibration errors in each axis. It was designed with mechanical / encoder based tracking systems in mind, which are susceptible to movements that are not accounted for by the tracking system data, e.g a droop at the end of a long crane arm.
While this tool does not tell you how to fix any errors, it can show you where to look for a problem.
Navigation
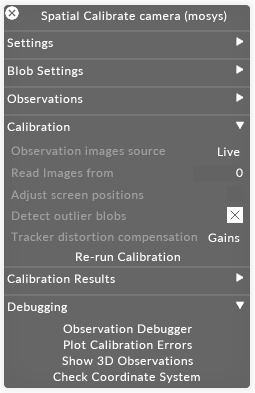
Please note: The Plot Calibration Errors graphs is located within the Spatial Calibration-Debugging menu
- 'Plot calibration error' graphs each observation in the list as a single plot. The observation number is displayed next to the plot.
- The controls in the top left allow you to choose to display positions and rotations on either x or y axes.
- The graphs auto-scale, so pay attention to the measurements on each axis.
- The Y axis for each plot is the error in the axis (difference between the solved position in disguise and the position from the tracking position)
- The X axis is the position value
How do I use it?
- Trends in the graphs, e.g. a straight line between plots, shows that there may be some causality between the movement and the error.
- Use the magnitude of the error and the magnitude of the movement to discern whether trends are just noise, or whether there is a true trend in axes affecting one another.
- More observations provide more data with which to spot trends. It will not be possible to reliably spot a trend with only a couple observations.
- Not every observation you've taken will necessarily show a change in position on every axis, so the data can look a bit random. This is fine and normal.
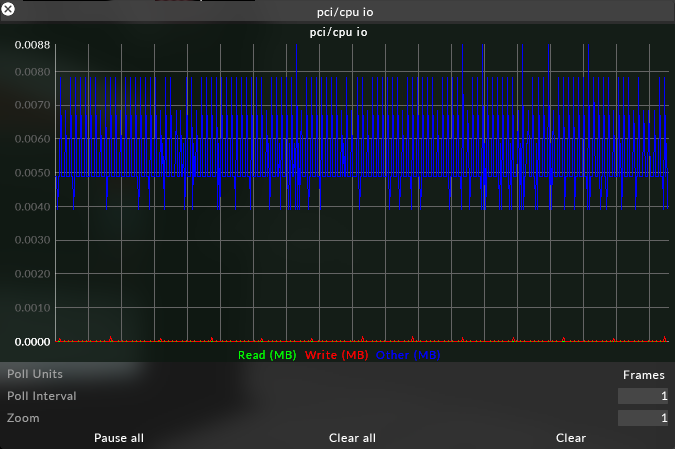
What is it?
Read
Graphs the data the CPU is reading from PCI devices.
Write
Graphs the data the CPU is writing to PCI devices.
Other
The number of bytes transferred during operations other than read and write.
How do I use it?
It is very unlikely that this graph will be needed in normal operation. Could be used if a fault with a PCI device or the motherboard is suspected.
What is it?
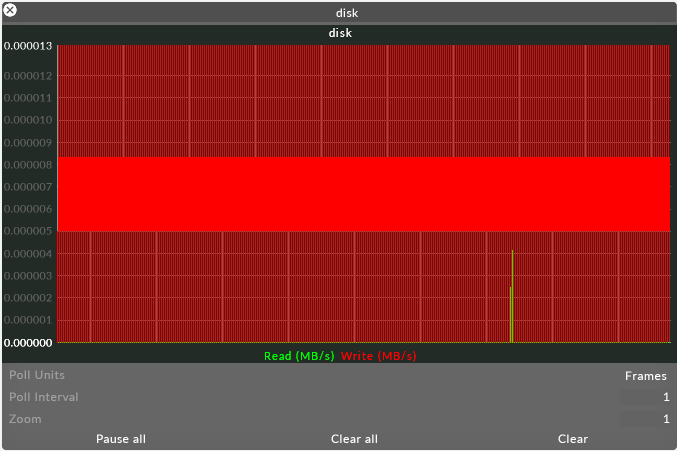
Shows the read and write disk speed in MB/s.
How do I use it?
Could be used to see if you were bottlenecked somewhere e.g. read speed would go up and then plateau.
What is it?
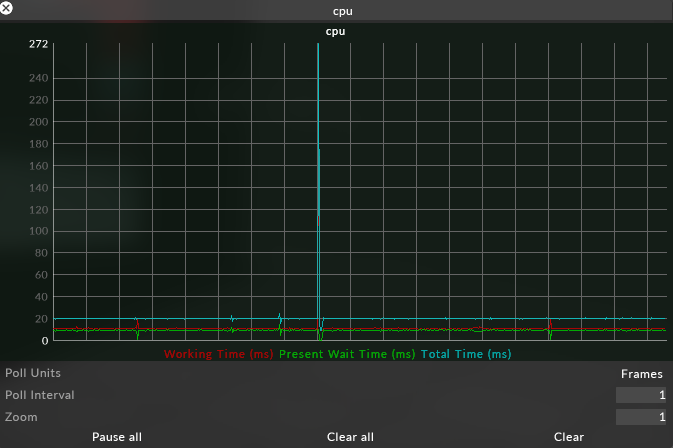
The CPU graph is cumulative.
Working Time (ms)
The amount of time spent on the CPU
Present Wait Time (ms)
The amount of time waiting to present. When running a project in normal latency this should be flat, but when running in ultra low latency this series will be 'spikey' as there's no queue.
Total Time (ms)
Total time is the cumulation of working time and present wait time, and should always sit beneath the ms required at your FPS.
How do I use it?
In a normal setup, total time should be flat because disguise takes the full CPU cycle to present a frame. At the end of every update loop, something is given to the GPU to present. If that loop is finished early, then there has to be a wait before there is a slot available in the queue.
If the CPU working time is high and the present time is low, then this is because the queue is empty. If frames are dropped in this scenario, then it is because of CPU load.
What is it?
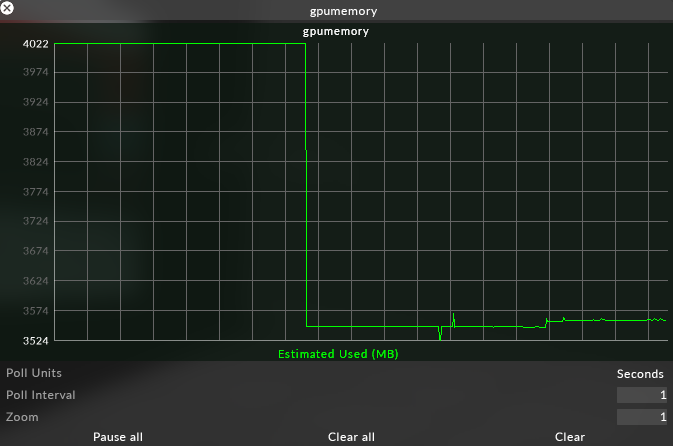
This graph shows the amount of memory that the GPU is currently using.
The GPU is responsible for dealing with its own memory allocation, but disguise tries to be as efficient as possible with the GPU memory it requires.
All textures that are rendering onscreen in the GUI are bitmaps that are uploaded to the GPU. This includes all GUI elements, as well as any media that is playing back.
disguise tries to reduce the amount of GPU memory in use by evicting textures when they are no longer needed. If textures are not used for a while, they are evicted. Conversely, some textures e.g LUTS are expensive to upload to the GPU, but once they are uploaded they are fast to use. For this reason, disguise tells the GPU to keep these textures alive.
How do I use it?
Not commonly needed, but if a bug e.g. a memory leak, is suspected, a constantly increasing GPU Memory value is useful information for reporting the suspected bug. GPU Memory will increase as textures are uploaded, and decrease as they are evicted.
What is it?
actualFrameTime is the clock of the next upcoming present, and the delta is the amount of time passed between each frame time.
How do I use it?
This value should remain constant, at a value dictated by the fps of the system.
